

these are the hottest and coldest ZIP codes in the connecticut housing market
/
By Kylie Clifton | Published on August 26, 2026
Danbury’s housing market has been busy, with substantial new residential development adding homes to the market.
Look at home values this year, though, and Danbury barely moved. After adjusting for inflation, values rose less than 1% — among the flattest numbers in the state.
That difference between activity in a housing market and the direction of home values is important when looking at Connecticut this year.
Zoom out to the whole state and a clear geographic pattern emerges. Home values climbed fastest in Fairfield County, in Connecticut’s southwest corner near New York City. They fell or stalled most in the state’s more rural inland counties, particularly Litchfield in the northwest and Windham in the northeast.
CT Insider analyzed several years of Zillow home-value estimates for Connecticut ZIP codes to see how the state’s housing market has changed over time and where values are moving now.
To rank the state’s hottest and coldest ZIP codes, CT Insider compared values in July 2025 with July 2026, the latest month available, and adjusted for inflation. The broader analysis also examines monthly Zillow data going back several years to put those one-year changes in context.
The estimates come from Zillow’s Home Value Index, which tracks the estimated value of a typical home rather than simply calculating the median price of homes sold in a given month. A monthly median sale price can swing depending on which homes happen to sell. Zillow instead estimates values across the housing stock, including homes that did not change hands.
That’s what “hot” and “cold” mean here. A hot ZIP code is one where inflation-adjusted home values increased the most over the past year. A cold ZIP code is one where they increased the least or declined. The ranking does not measure how many buyers are looking, how quickly homes sell or how active the market is.
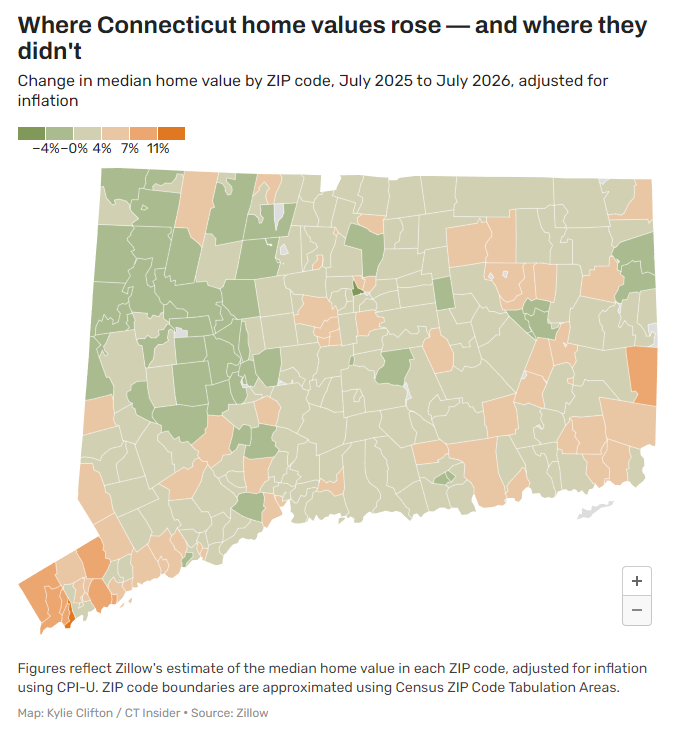
Nine of Connecticut’s 10 fastest-rising ZIP codes are in Fairfield County, including five in Greenwich. Litchfield County was the only county where the typical ZIP code lost value after inflation, while Windham County posted the second-weakest numbers.
But the map also illustrates why activity and rising home values aren’t necessarily the same thing.
Danbury is one example. The city has seen substantial new residential construction, adding supply at the same time that its inflation-adjusted home values remained nearly flat.
The Zillow data doesn’t show where buyers are concentrating their attention or explain why Danbury’s values moved so little. It does show that a market can add housing and see activity without the value of its typical home rising at the same pace as elsewhere in the state.
Hamden offers another example. The town has had a large number of new listings, giving buyers more homes to choose from. Its home values still rose — about 2% to 3%, roughly in line with the statewide pace — but nowhere close to Fairfield County’s gains.
More homes for sale isn’t necessarily the same as rising home values. The two measures capture different parts of the housing market.
Fairfield County sits at the other end of Connecticut’s map.
But Zillow’s index isn’t simply capturing a handful of expensive sales. The typical home in Greenwich’s priciest ZIP code, 06870, gained more in value over the past year than a typical home is worth in some Litchfield County towns.
Litchfield County presents the opposite picture.
The county has some of the state’s most expensive listings, including properties marketed as weekend retreats for buyers from New York City. Yet inflation-adjusted home values weakened over the past year.
The Zillow data cannot establish why that happened. It does, however, show that the weakness extends beyond the prices of homes that happened to sell in a particular month. Because Zillow’s index estimates the value of the broader housing stock, changes aren’t simply a reflection of a handful of unusually expensive or inexpensive sales.
The weakness also marks a departure from Litchfield County’s recent history.
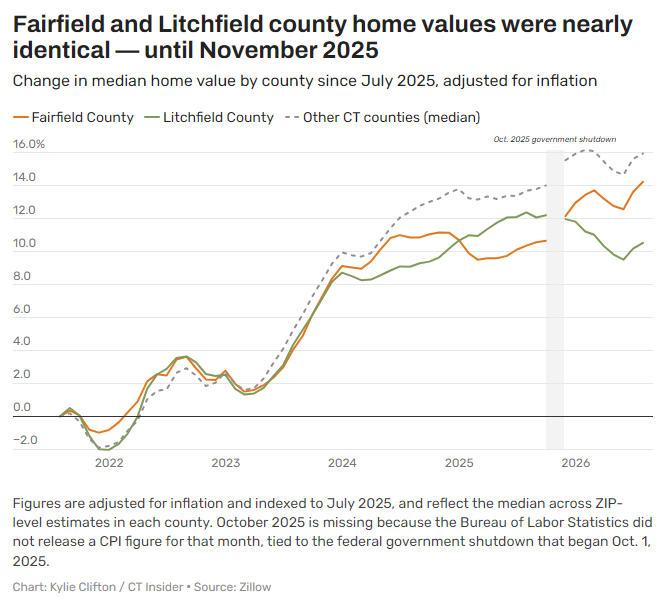
For much of the past five years, home values in Fairfield and Litchfield counties, along with the rest of Connecticut, generally climbed and dipped together. There were stretches when Litchfield even outpaced Fairfield.
Only recently did their paths clearly separate.
The shift began to emerge in late 2025 and became more pronounced in 2026. Fairfield County pulled ahead while Litchfield fell behind, putting counties that had spent years following broadly similar trajectories on opposite ends of Connecticut’s map.
Danbury helps show the limits of any “hot” or “cold” ranking. Its housing market kept building and selling this year, yet the typical home is worth almost exactly what it was a year ago. In Connecticut, a market can be busy without gaining value, and it can gain value without being the busiest place in the state.
Alexander Soule contributed reporting.